RPC Data Quality Monitoring
 The RPC system performance is monitored by RPC Data Quality Monitor (DQM), based on the CMS Data Quality Monitoring (DQM) framework and running on the High-Level Trigger Farm as well as on local DAQ systems.
The purpose of the RPC DQM is to follow the time evolution of relevant quantities describing the running conditions of the detector and its performance. The aim is to spot possible problems or system instabilities, and promptly correct for them during the data-taking, and to monitor all the high-level quantities that are needed by the offline reconstruction.
The task of RPC DQM is fulfilled in three steps:
- The Monitoring Elements are defined, filled with relevant event information by the source application;
- A Client application accesses the MEs, performs further analysis and generates alarms;
- The Graphical User Interface (GUI) provides tools for visualization of the monitoring elements.
Source
Depending on the type of data accessible by the source, the DQM application can be classified in two categories:
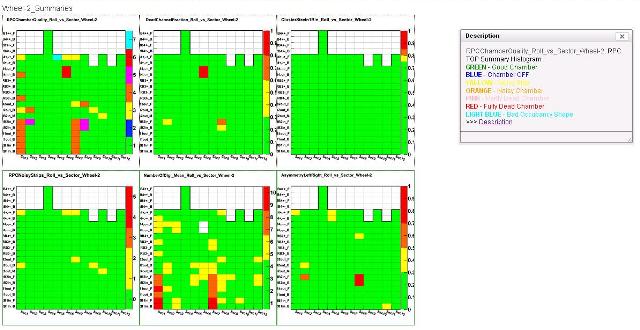
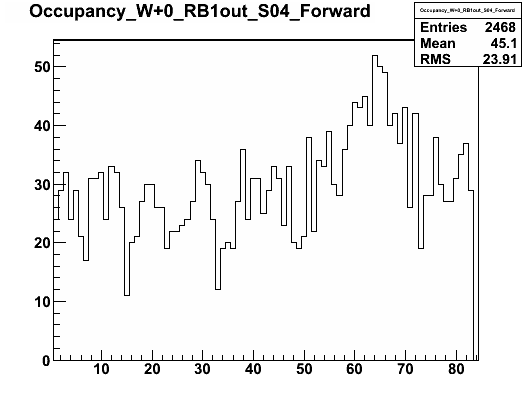
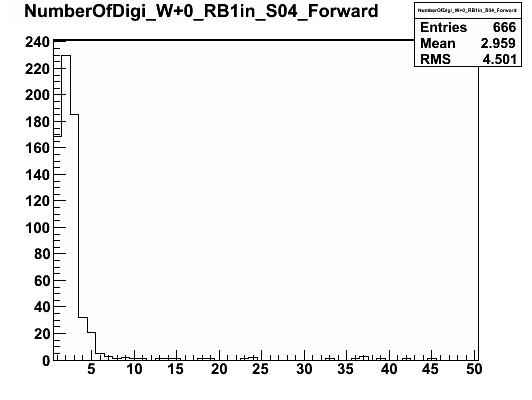
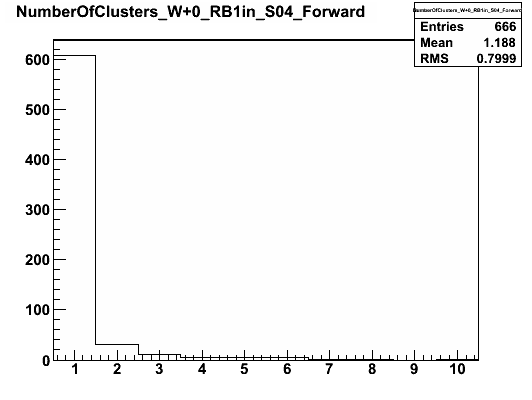
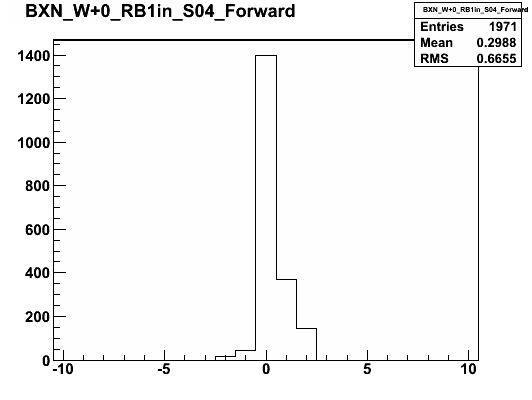
- Online DQM: the source applications can directly run on the Filter Unit (FU) nodes of the Filter Sub Farm of the CMS Trigger & Data Acquisition system. The monitoring elements are created and filled there and sent to the client. Regarding Online DQM we have real-time monitoring opportunity of our system. Due to CPU time limitation, RPC Online DQM provides small set of MEs for each double gap, but enough to spot problems at detector or readout electronics level; those MEs are: ClusterSize, Multiplicity, Bunch crossing, Number of Clusters, Number of Digis, Occupancy, FEDintegrity
- Offline DQM: the source application reads events from the stored files and provides all MEs mentioned above plus high level MEs like efficiently, noise, radiography
Client
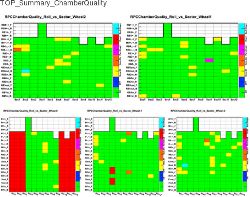
DQM Client part reads MEs provided by source and performs frequent analyses at the end of every 10 luminosity section (typically every 10 minutes) and at the end of each run, such as application of quality tests, comparison with reference histograms, and a compilation of key distributions in summary ME’s. In addition, a logic is applied that defines the goodness of the data for future analysis from the view of the RPC detector. These global data quality flags are based on information from the data acquisition system, the detector control system DCS, and on the DQM results.
GUI
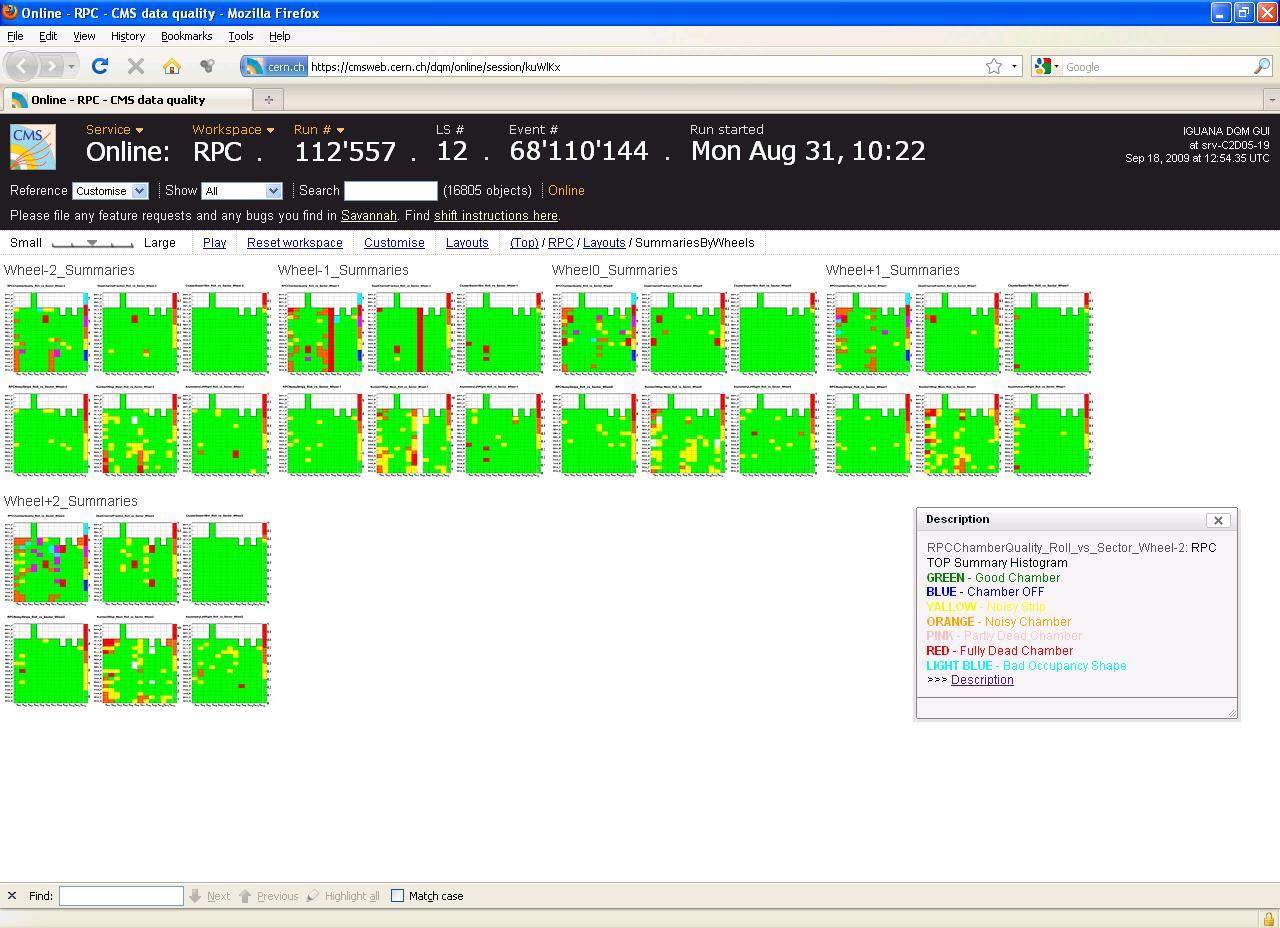
The DQM data are visualized with the help of the central CMS DQM GUI, which is used by a central shifter to monitor the quality of the data taking, as well as sub-system shifters and experts. All ME’s can be viewed and overlaid to reference histograms. This can be done for the ongoing data taking run as well as for archived runs, and for the processed DQM data at Tier-0.
References
Image gallery